

2024-02-20
Which are the pages in the SAM One report?
Introduction
SAM One is an analysis report and insight tool that uses information from your Microsoft platform and subscription. The SAM One report brings together information that is otherwise hard to find and difficult to compile. The report tool simply provides clear and concrete insights that make it easy to take action.
Read more under each heading below. Bonus points if you also have the demo report open (if not, visit it here).
Drill Through functions
In Power BI, and by extension SAM One, the drill through feature is available. It is a way to cross-filter data and show more detailed information about specific fields.
Drill through can be used by right-clicking, hovering over drill through and selecting one of the views that then appear. For SAM One, drill through is the way to get more in-depth information about individual apps, users, devices or licenses - instead of seeing overall organizational data for each area.
Click to filter
Almost all information listed in the report can be filtered. Try clicking on any field to update other related information.
Export all relevant data
Each table and list can be exported as an Excel file for further processing, or for sharing with relevant recipients who do not have the SAM One report themselves. This makes it easy to share any information that is important.
The usefulness of historical data
The SAM One report performs periodic data retrievals, which means that earlier datasets can be compared to more recent ones (and of course all information is stored by the user - nothing data stored by SAM One). Therefore, trends can easily be identified regarding, for example, version numbers, application numbers and license numbers.
Organizational Overview
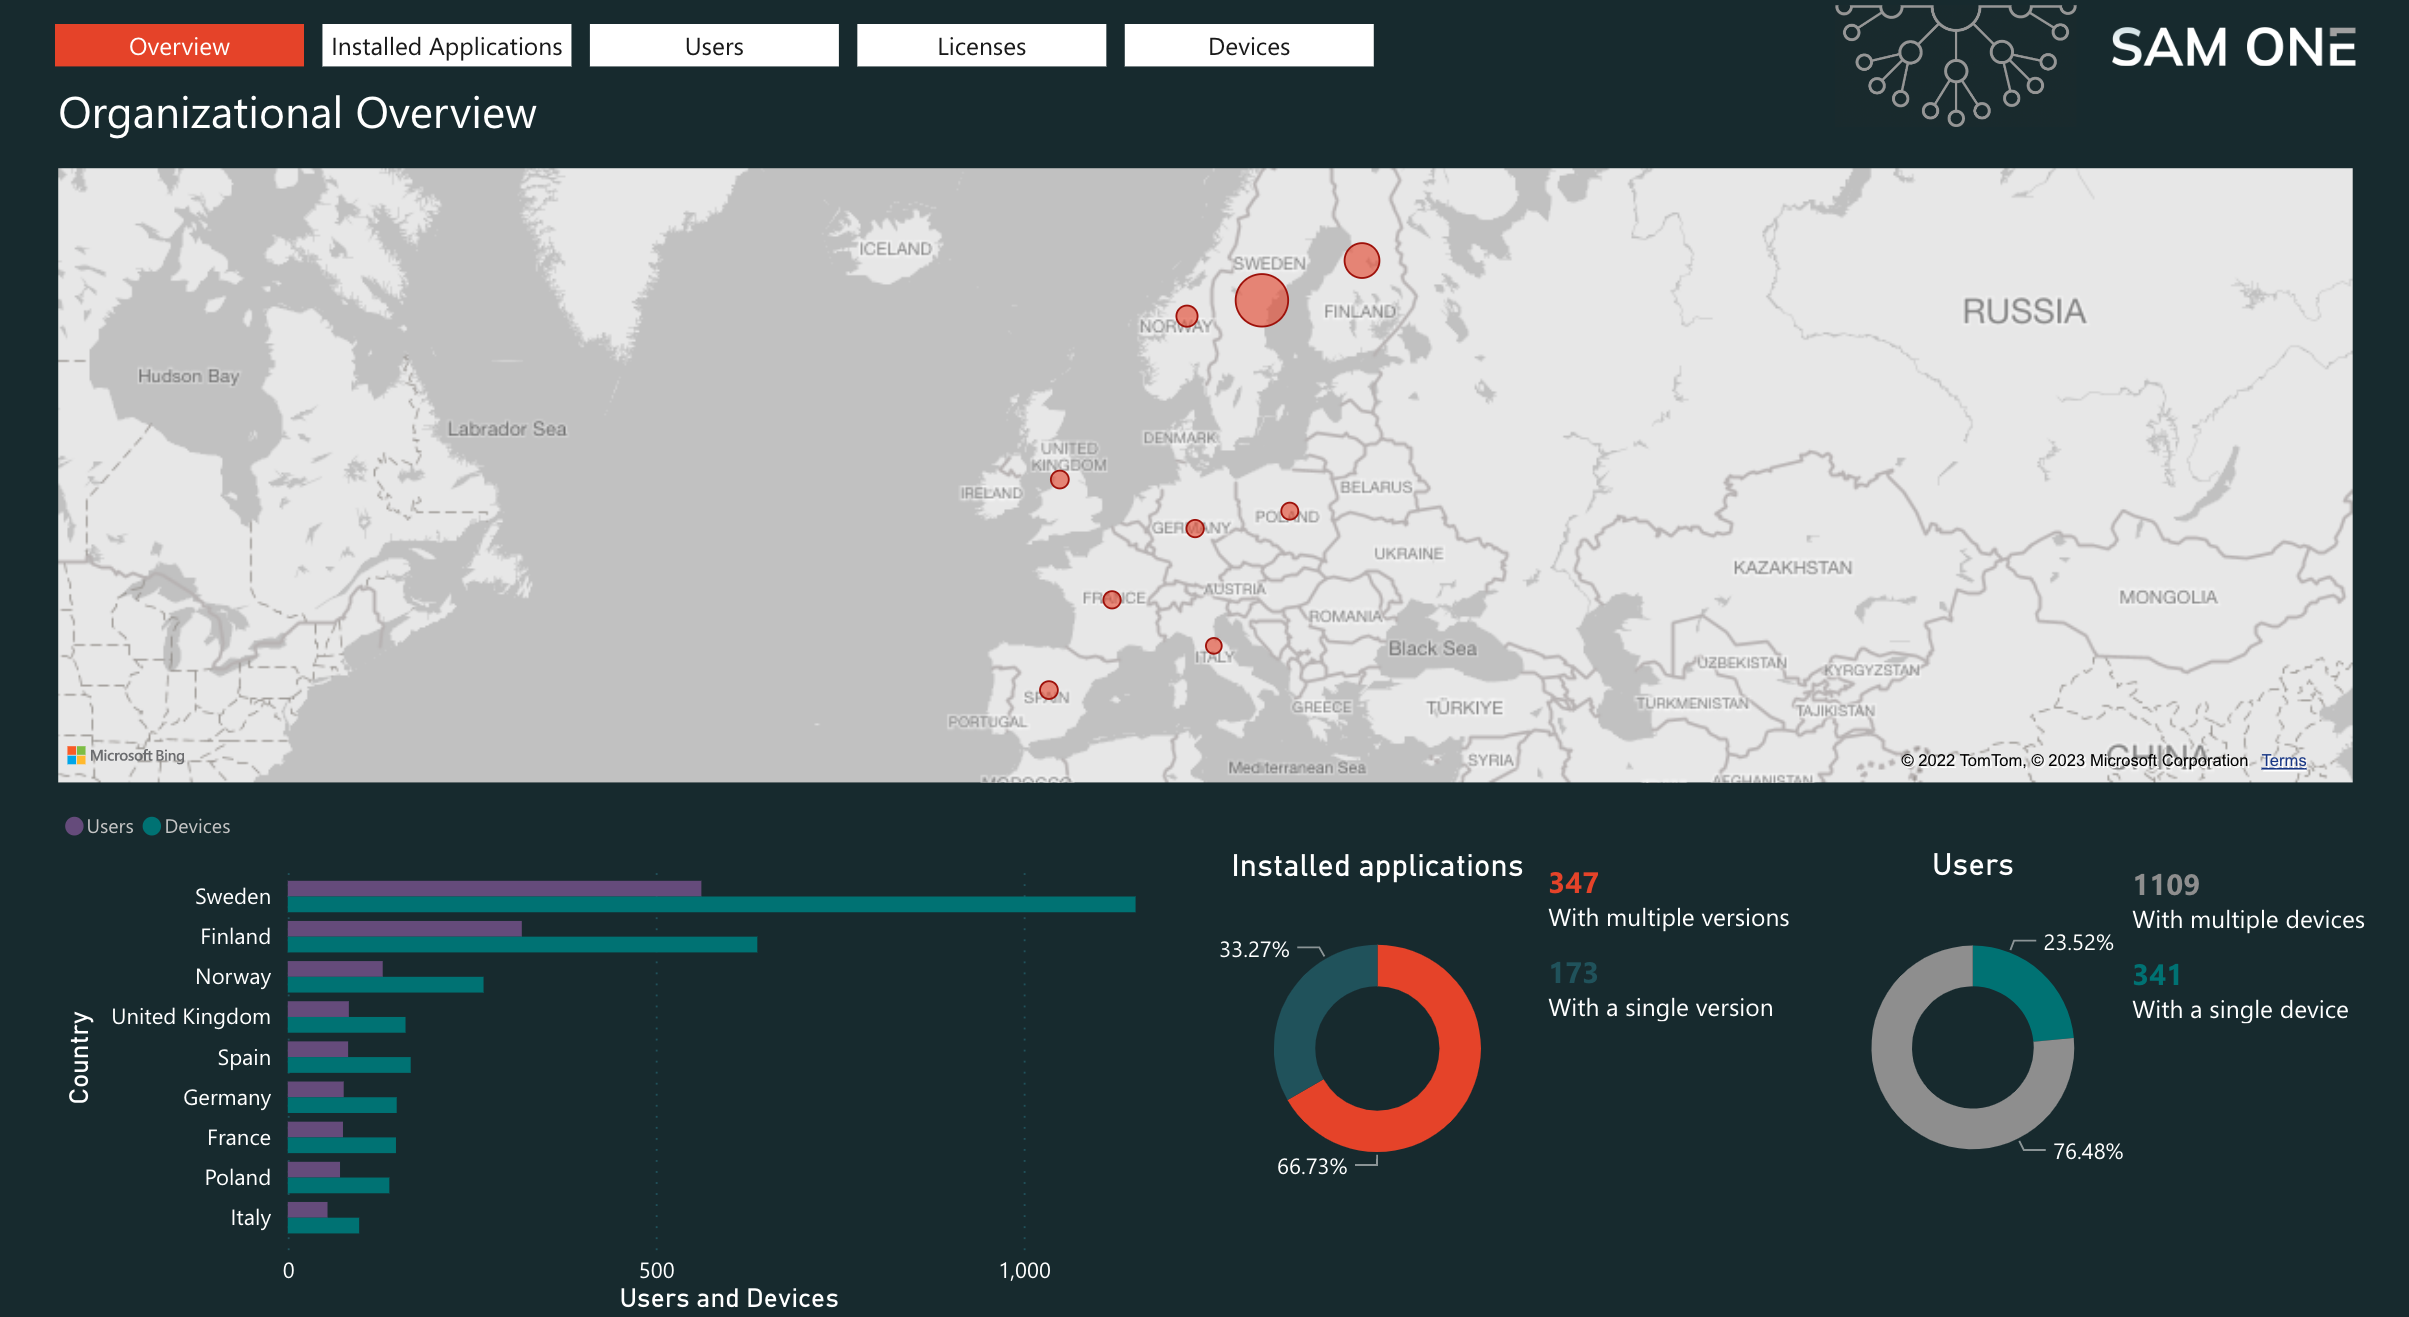
The first page is the overview which has a large map placed in the center.
Hover over any orange ring in the map to see information about that country, specifically:
Country
Users
Devices
Users with multiple devices
Applications
Apps with multiple versions
In the lower left corner you can see a number of bars. These list the number of users and devices in each country.
In the lower right corner you can see the headings Installed applications and Users.
Installed applications shows all applications in organizations with the percentage of applications installed with one or more versions.
Users shows the distribution of the organization's users who have one or more devices.
Installed Applications
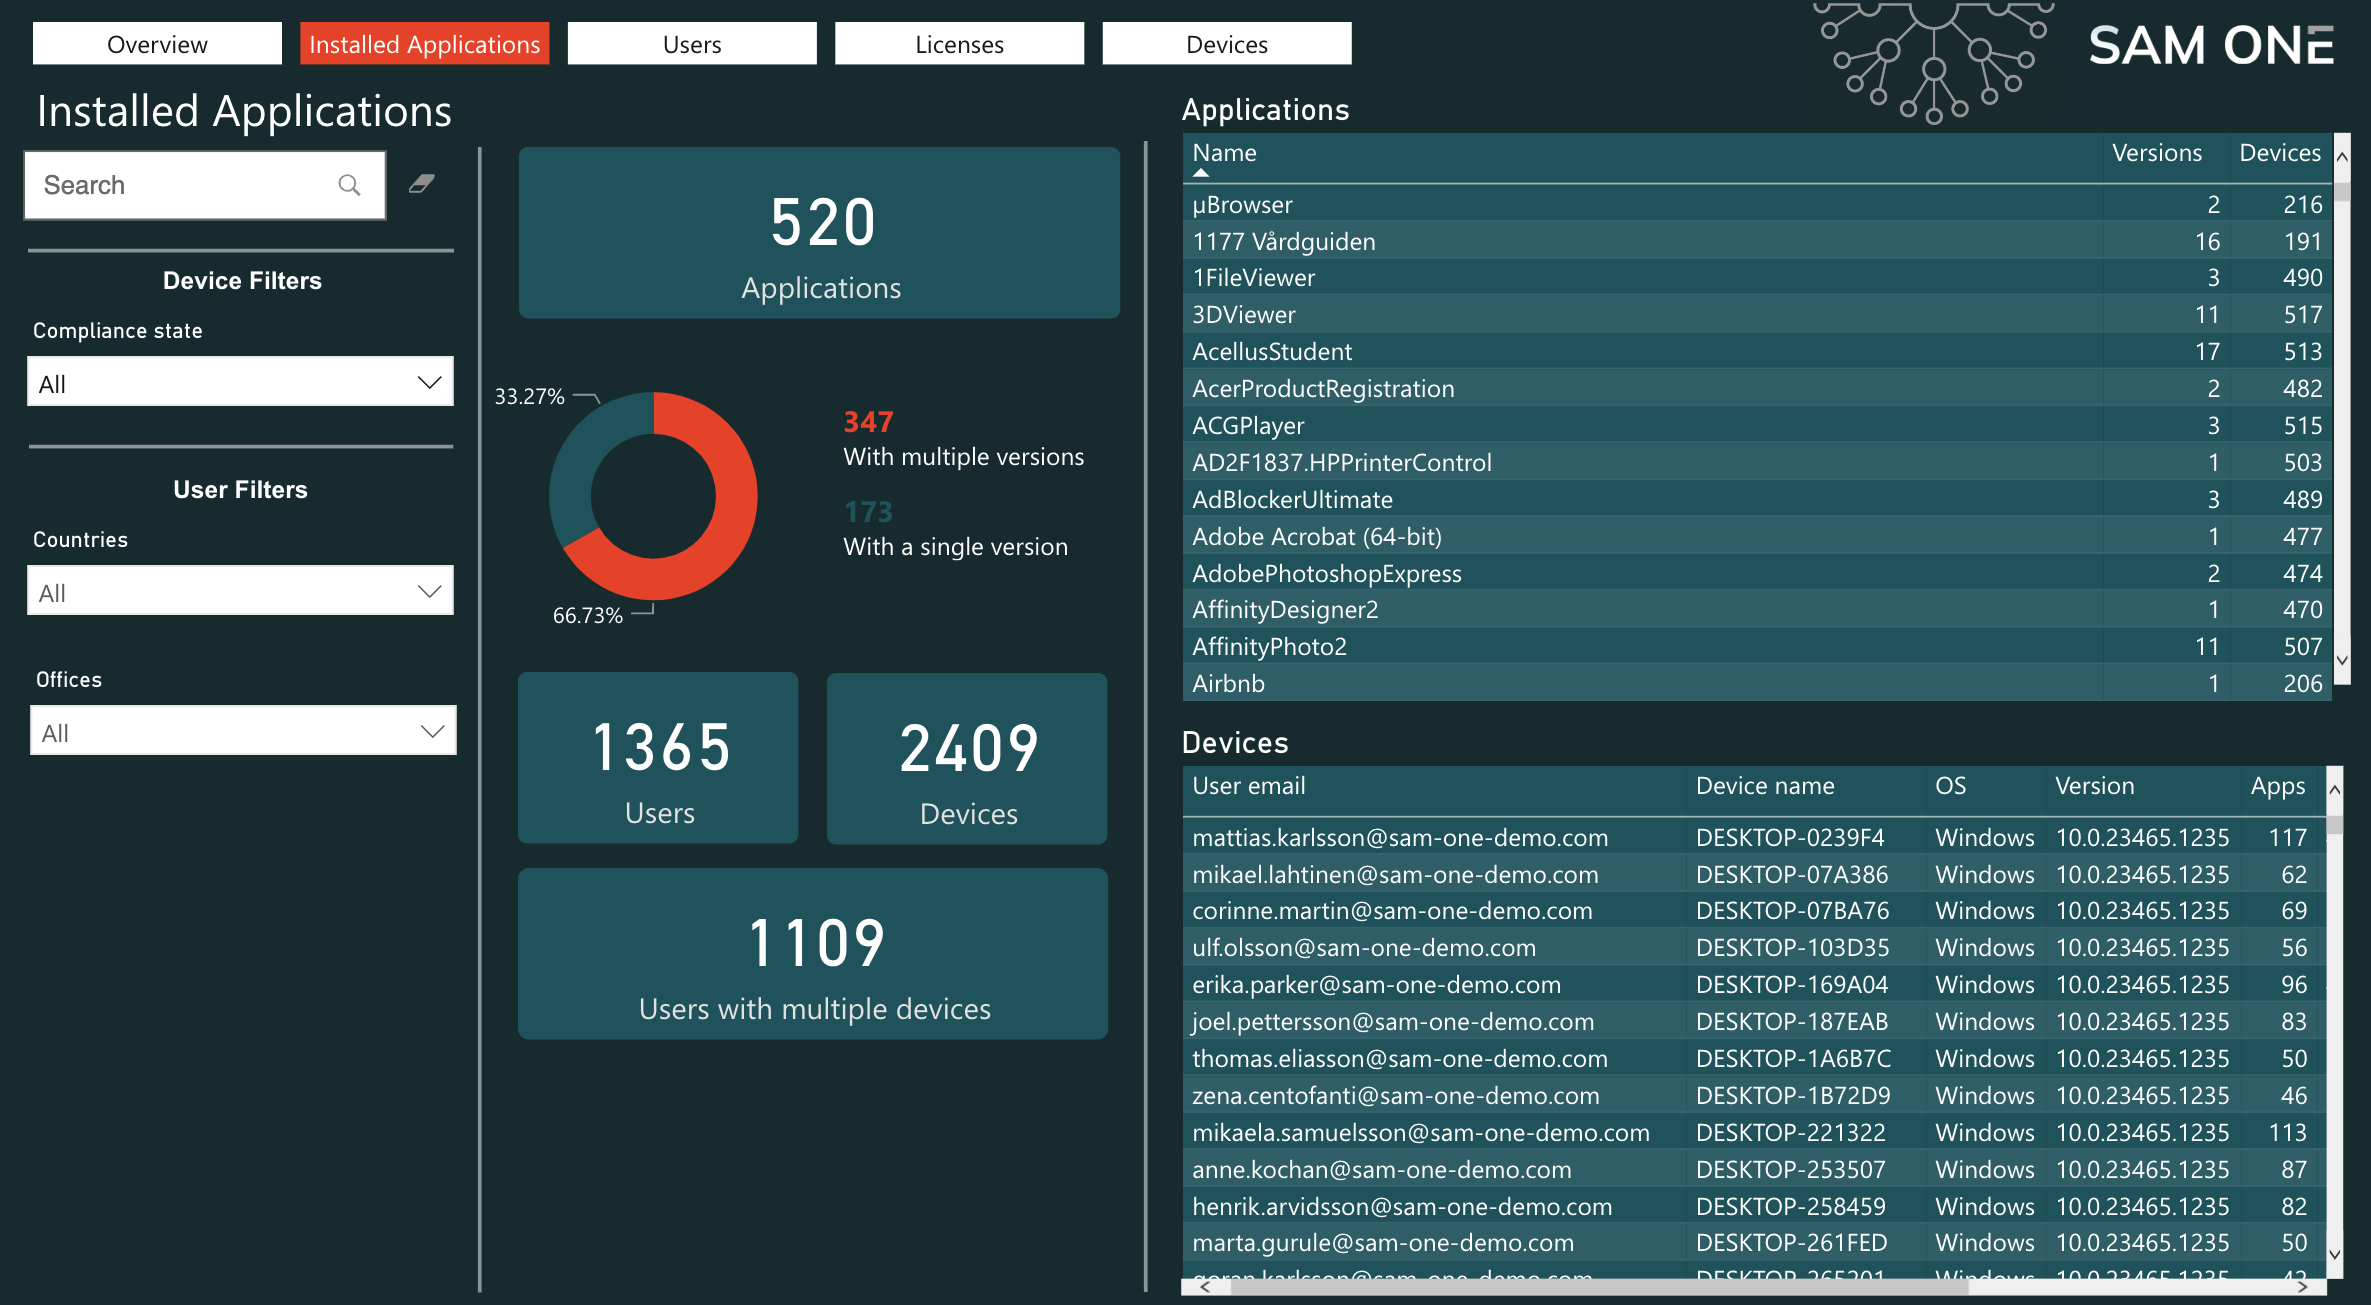
In the overview view of installed applications, various filtering options are available on the left side. You can free text search for an application, filter devices by compliance status, and filter users by country and/or office location. The application list is updated according to the filters turned on, and only shows applications installed on the devices that match.
The center of the Installed Applications page shows the total number of applications in the organization, the percentage of applications with multiple versions, the number of users and devices in the organization, and the number of users with multiple devices.
The right side of the Installed Applications page shows the full list of installed applications and the full list of devices in the organization. Click on an application to see the devices that have the application installed. Alternatively, click on a device to see which applications are installed on the device.
Detailed Application Information

By going to the drill through view for an application, information specifically related to that application is displayed. In the upper left corner, the number of versions that the application has installed in the organization is shown, as well as the number of devices that have that application installed. Directly to the right you can see which versions are involved, where it is possible to filter the device list according to which ones have a particular version installed.
In the upper right corner you can see the heading Versions over time, which shows how the number of versions has varied over time. This graph is affected by new versions being published (installed) and internal efforts to keep the version count as low as possible.
The bottom half of the page shows a list of all applications that have the application installed, as well as which user the device belongs to. In addition to the list being updated depending on the filtering, it is possible to go to other drill through views, for example to get more information about a specific user.
Users

The Users page displays the user list for the entire organization. It lists all users that are in Microsoft Entra ID (including any user directories that are synchronized with Entra ID). Above the user list itself, there are a number of different filtering options, including the free text search, filtering by country, office, department and user type.
On the right, above the user list, you can see a quick overview of which users in the current filtering have licenses, and how many users in total match the filtering. The default mode has no applied filter, meaning that it shows the entire organization.
Detailed User Information
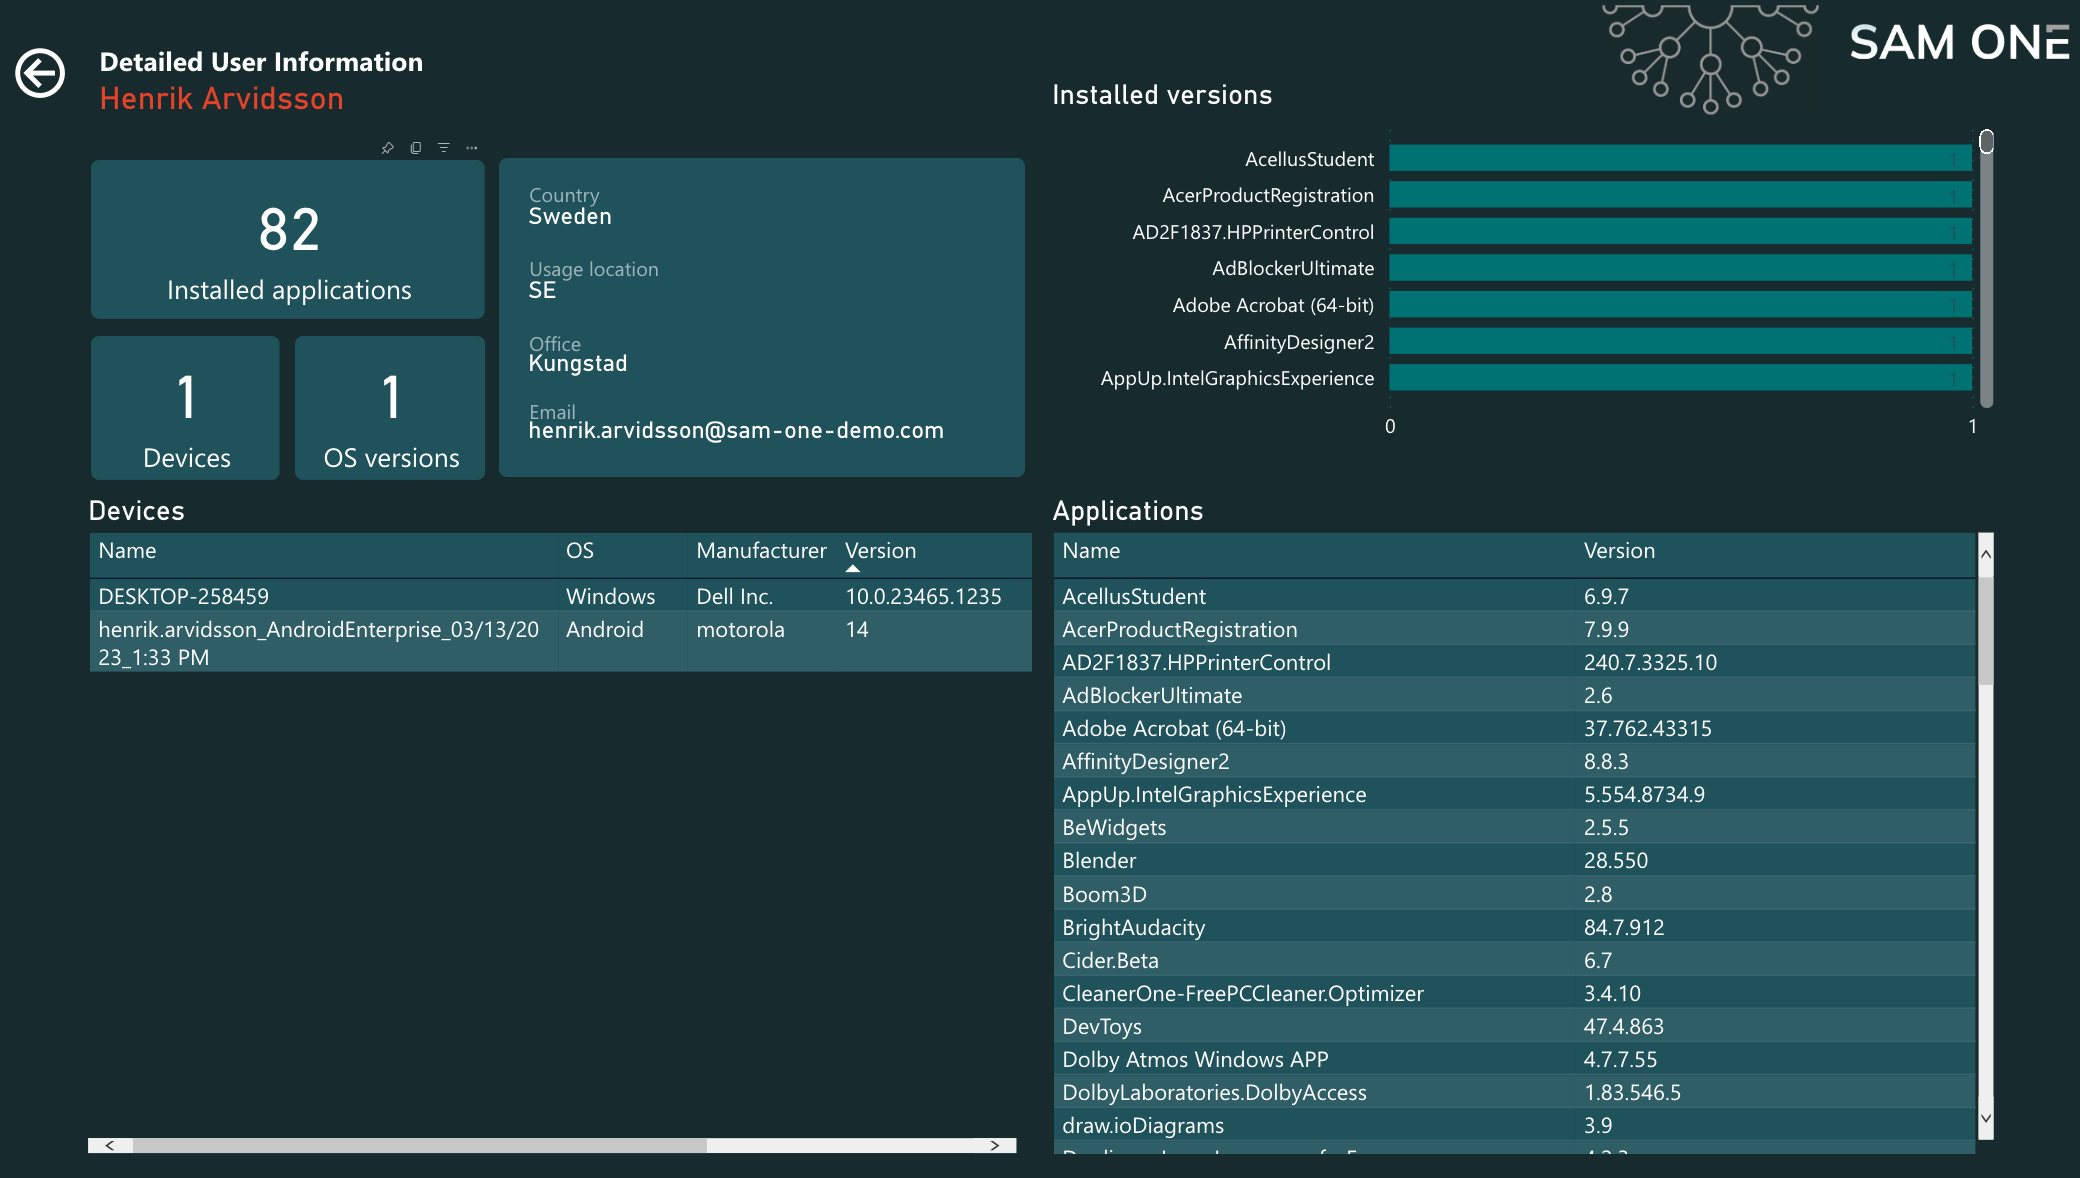
The Detailed User Information view shows information filtered for a specific user. In the upper left corner, you can see general information about how many applications are installed on all the user's devices, and how many devices the user has. Information about the user itself is also displayed, such as country, office and the user's e-mail.
The top right corner lists the number of versions of all the user's applications, sorted in descending order. Below the version list is the complete list of the user's applications. In this view, you can click on a device, a version or an application, for example, and the relevant fields will be updated.
Licenses
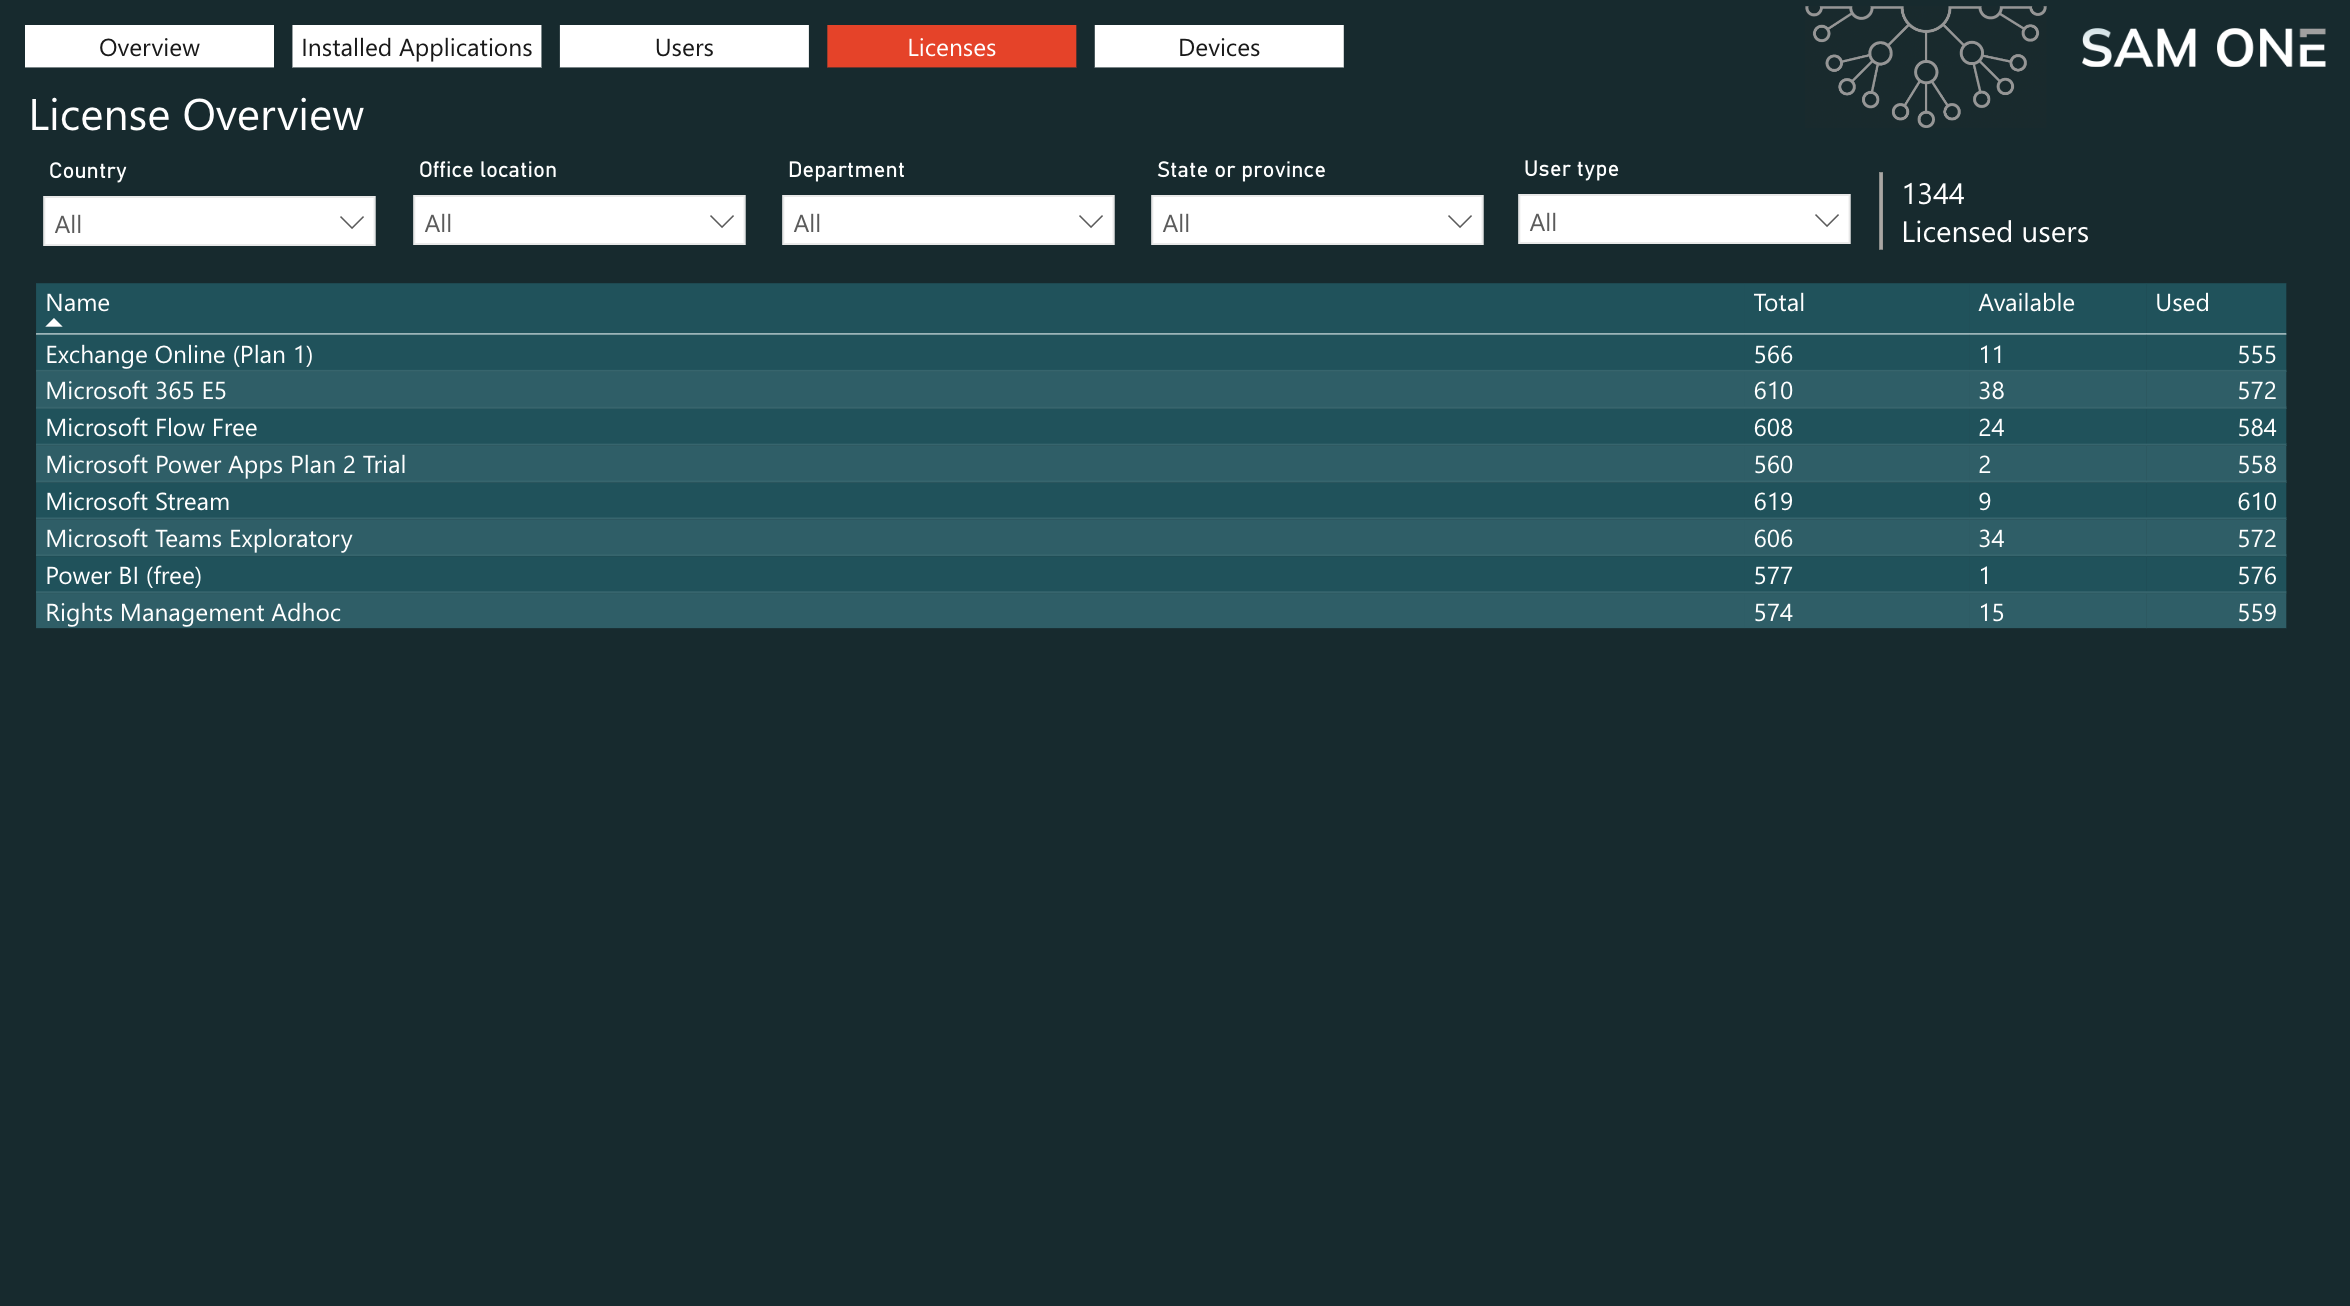
Under the Licenses tab is the License Overview heading, followed by filtering options and the organization's list of Microsoft licenses. Without any filters, the entire license pool is displayed in the Total column. Available shows how many licenses have not been assigned to users, and Used shows how many have been assigned to users.
A very relevant and useful feature here is that the number of licenses in the Used column is adjusted according to the filtering. This makes it easy to see everyone who has licenses in a certain department, in a certain country, or even more narrowly. This makes cost allocation easy in larger organizations, where the desire is often to allocate license costs to each country/department. In Microsoft's own portals or from license partners, this breakdown is often much more complex to produce.
The non-friendly way to search in Entra ID
It is worth emphasizing that user data specified in Microsoft Entra ID does not necessarily correspond what is entered for other users. For example, one user's country may be set to Sweden, another user's country to Sverige and a third user's country to SE. All refer to Sweden, but only one result will show up when searching for one of them.
In SAM One, whatever is listed under – for example – country is listed as a filter, making such information very simple to overview. By extension, this means that administrators do not have to free text search in Entra ID and therein more or less guess what could be entered in a user's country field. It might also provide a subtle hint that it's time to develop better processes for, for example, country naming conventions.
Detailed License Information

As a drill through function for the licenses, the Detailed License Information option is available. This view shows each user who has a specific license assigned. To the right of the filtering options is the total number of users that match, after filters have been applied.
User Licenses

Via tables that are listing users, you can drill through to get to the User Licenses page. The User Licenses page shows general information about the user, followed by a graph showing the number of licenses over time, and a list of all the user's assigned licenses.
Devices

The Devices view looks much like the Users and Licenses view, with corresponding filtering options. To the right of the filter row is the total number of devices and users that match the current filtering. In the list of devices, you can for example see whether a device is private or the organization's, and the compliance status of the device.
Detailed Device Information
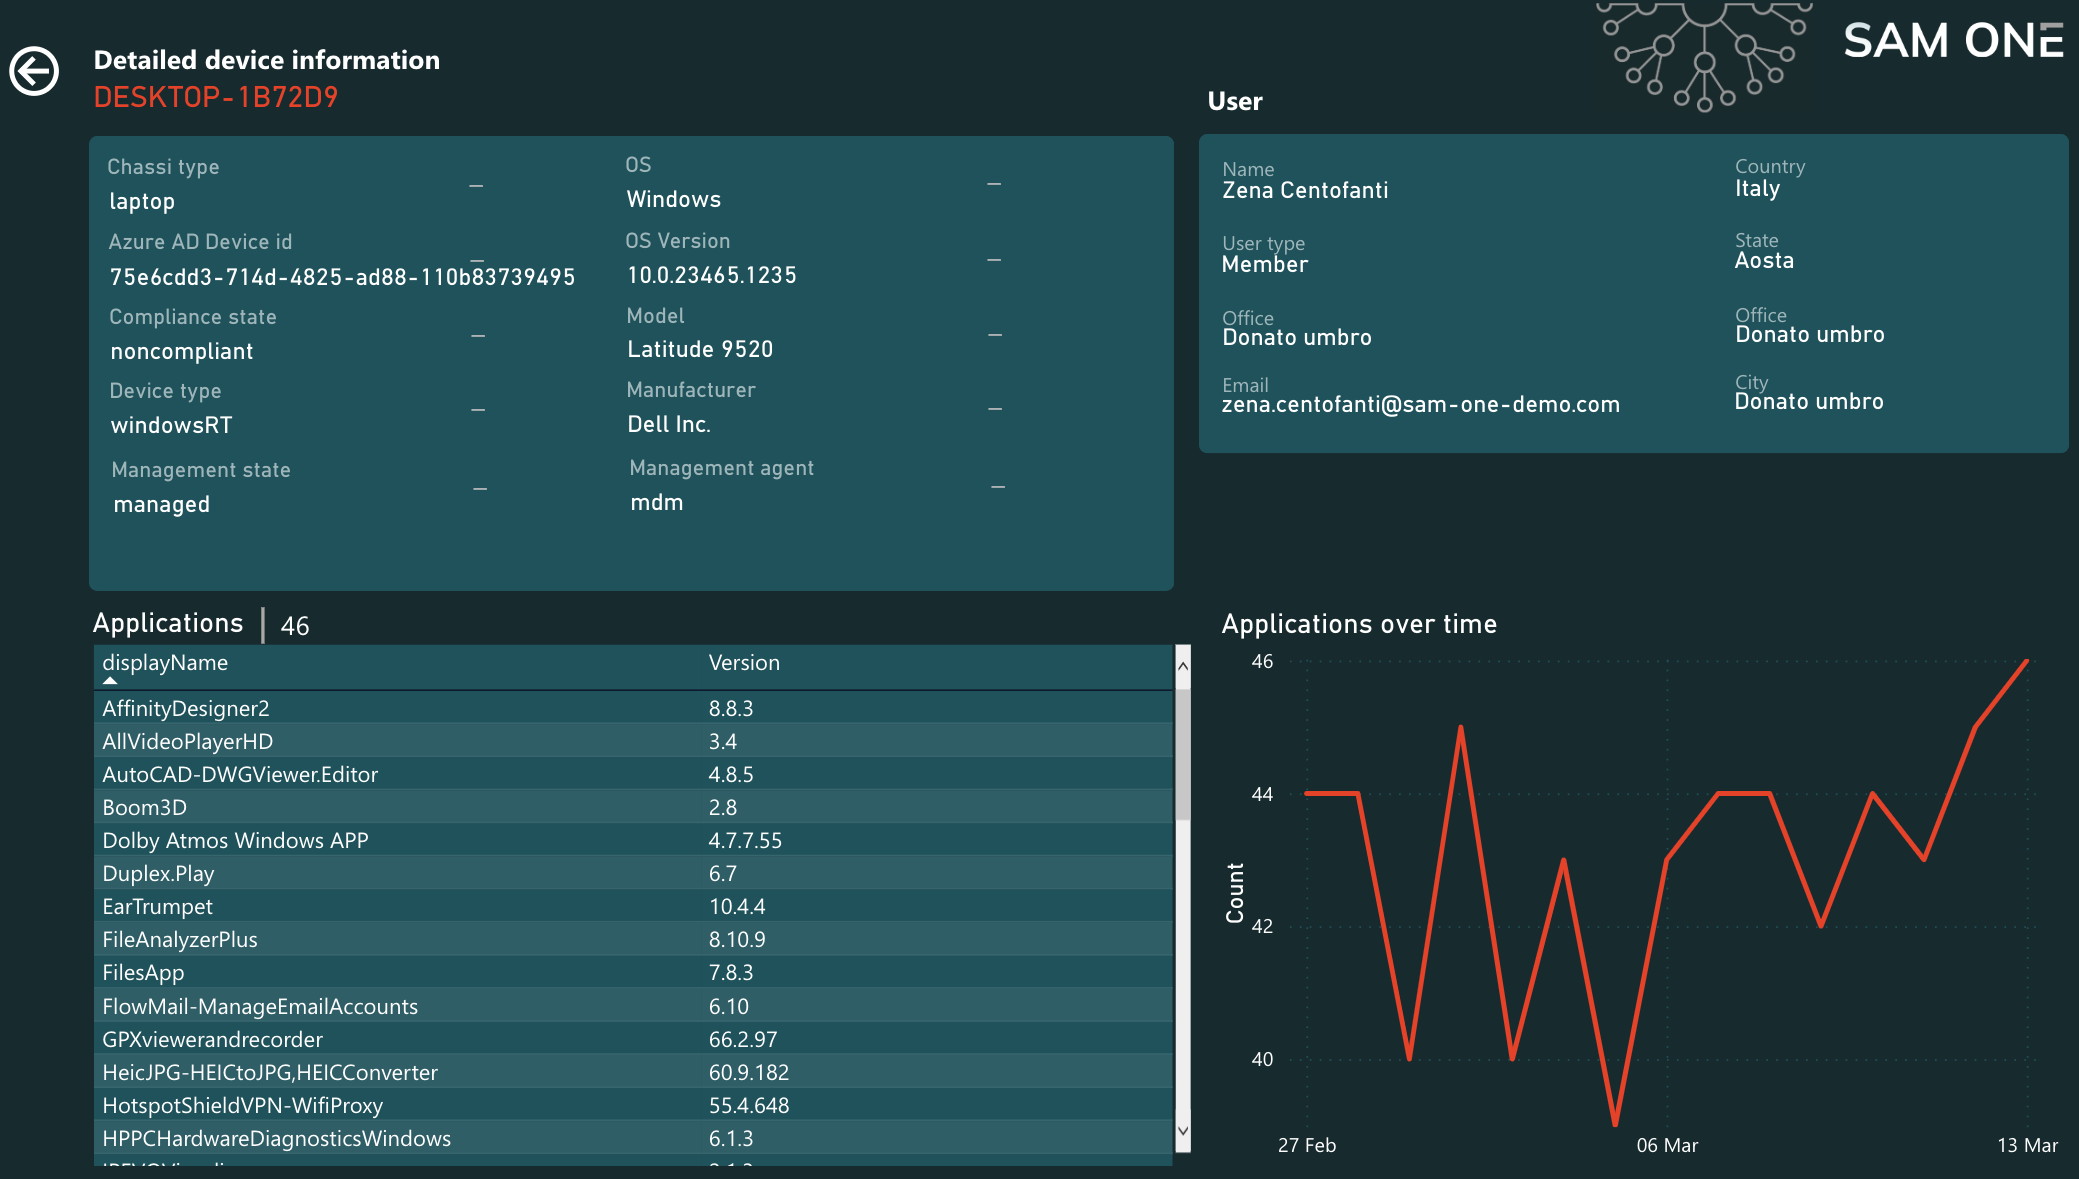
The drill through view for detailed device information shows in-depth information about a specific device. This includes the operating system, manufacturer and model. It also states whether the device is managed (i.e. it is enrolled in and managed by Intune). Overall information about the device's primary user is in the upper right corner. The lower half shows the device's applications; the list on the left and the amount of applications over time on the right.
Please note that, in the demo report, the application count is 0 for all Android devices. However, this only applies to the demo version, the devices are listed as they should in the actual SAM One report.
Conclusion
If you have any questions or would like to book an appointment for a detailed demonstration, or to purchase SAM One, the easiest way is to book an appointment with us. We are also available at the email address sales@sam-one.com.
As further reading, we recommend you take a look at the technical requirements for SAM One.


Sign up for our newsletter
Register your email address below to receive the latest information on SAM One.
Contact
Send us a message to:
Purchase SAM One.
Get answers to your questions.
Find out more about the benefits of SAM One.
